What is Technographic Data? Examples, Providers & Datasets to Buy


- Overview
- Datasets
- Providers
- Use Cases
- Attributes
- Guide
- FAQ
- Overview
- Datasets
- Providers
- Use Cases
- Attributes
- Guide
- FAQ
What is Technographic Data?
Technographic data is information collected and analyzed about the technology and digital behavior of individuals or organizations. Technographic data helps businesses understand their target audience’s technological needs and preferences, enabling them to tailor their products, services, and marketing strategies accordingly.
What Are Examples of Technographic Data?
Here are some examples of technographic data:
- Software Applications: Types of software used, like CRM, ERP, or marketing automation tools.
- Hardware Infrastructure: Details on servers, storage systems, and networking devices in use.
- Cloud Providers: Cloud platforms used, such as AWS, Google Cloud, or Azure.
- Security Solutions: Types of cybersecurity tools in place, like firewalls or antivirus software.
- Website Technologies: Web hosting platforms, CMS (e.g., WordPress), and analytics tools.
- E-commerce Platforms: Platforms used for online sales, like Shopify or Magento.
- Database Technologies: Database systems like Oracle, MySQL, or MongoDB.
- Programming Languages: Languages used for development, such as JavaScript, Python, or Java.
A company’s technology stack offers a unique look into the organization. It can reveal exactly what the organization is willing to spend money on, their level of technical know-how, and when they might be looking to invest in new technological help and martech solutions.
Technographic details provide you with this information, which you can then leverage for purposes like ABM and market segmentation.
Best Technographic Databases & Datasets
Here is our curated selection of top Technographic Data sources. We focus on key factors such as data reliability, accuracy, and flexibility to meet diverse use-case requirements. These datasets are provided by trusted providers known for delivering high-quality, up-to-date information.
Business technographic Data in Europe ( Techsalerator)
Factori US Technographic Data | | B2B Data / 300M+ Records / Updated Monthly
Global Technographic Data | Private Companies | Worldwide
CompanyData.com (BoldData) - Technographic Data (IT data from 380M+ businesses, 150+ countries)
Technographic Data | B2B Data | 22M Records | Refreshed 2x/Mo | Delivery Hourly via CSV/JSON/PostgreSQL DB Delivery
Technographic Data | North American IT Industry | Verified Profiles for 30M+ Businesses | Best Price Guaranteed
Tech Install Base Data | Technographic Data | Tech Stack Data | Global Coverage | 2000 Technologies | Verified E-mail, Direct Dails | 20+ Attributes
Venture Capital Data | Technographic Data | Company Tech Stacks | Uncovering Startups | 922M+ Records
Global Tech Install Data | 252 MM B2B Technographic Data & Consumer Records | Tracking 250K Technologies
Coresignal | B2B Data | Technographic Data / Global / 3.5M+ Records / Updated Monthly
Can't find the data you're looking for?
Let data providers come to you by posting your request
Post your request
Top Technographic Data Providers & Companies
-

Canaria Inc.
CoverageUSAUK+248VAs an AI-focused nonprofit, we've found Canaria Inc. to be an invaluable partner in understanding job market trends. Their comprehensive datasets, sourced responsibly from platforms like Indeed and LinkedIn, coupled with their advanced AI and NLP processing (this enables us to get additional insights which are not natively available in the source such as predicted salary, seniority level etc.), provide unmatched insights into the labor market. Their high deduplication rates ensure the accuracy and utility of the data, essential for our strategic planning and analysis. Canaria's tailored pricing and client-centric approach make them a top recommendation for any organization needing detailed labor market analytics.
-

Coresignal
CoverageUSAUK+247VCoresignal has strong demographic and firmographic datasets both on quality and volume while keeping the data as fresh as it can be. We've been using Coresignal for years and we can only speak highly about the product and team behind it. Highly recommended.
-

Forager.ai
CoverageUSAUK+248VWe use Forager to enrich our contact data with email addresses and mobile phone numbers. Additionally, we leverage Forager to source net-new contacts at our target accounts. After analyzing all the data providers we use, we found Forager to deliver the best overall data quality. We are highly satisfied with the results Forager consistently provides.
-

Infotanks Media
CoverageUSAUK+247We are a data-driven digital marketing company curating high-quality databases for successful sales and marketing campaigns.6XHigher ROI95%Data Accuracy95%Email Deliverability -

Wappalyzer
CoverageUSAUK+247Sell and market more effectively with technographic insights. We track over a thousand technologies accross websites of millions of companies to help you to identify new prospects and increase your addressable market.4,500Technologies tracked2,500,000Users40,000,000Websites tracked -

Rhetorik
CoverageUSAUK+248Supercharge your business with our unmatched global coverage. No other B2B data provider in the industry offers qualified contacts, professional profiles, and company profiles like Rhetorik does.270m+Companies810m+Contact Profiles80m+Valid Work Emails
Popular Use Cases for Technographic Data
Technographic Data is essential for a wide range of business applications, offering valuable insights and driving opportunities across industries. Below, we have highlighted the most significant use cases for Technographic Data.
Main Attributes of Technographic Data
Below, we outline the most popular attributes associated with this type of data—features that data buyers are actively seeking to meet their needs.
| Attribute | Type | Description | Action |
|---|---|---|---|
| String | The name of a company or business, might be the legal or brand name. | View 71 datasets | |
| String | The name of a city. | View 68 datasets | |
| String | The industry classification of a company. | View 68 datasets | |
| String | The domain name of a company website. Potential ID to match company records. | View 65 datasets | |
| String | The approx. number of employees working for a company. | View 65 datasets | |
| String | The phone number of a company. | View 56 datasets |
What Are the Sources of Technographic Data?
The main sources of this category of B2B data are typically resources provided by the company itself, though they are not always easy to access. Examples include the company’s website source code, social media posts, and information shared through reports or gathered via phone calls. These insights are then compiled into a B2B database.
Different collection methods are employed depending on the source, and the quality of technographic data is often linked to how it was collected. Generally, it’s important to ensure you are working with technographics companies and B2B database providers that use a variety of sources and collection methods to ensure data reliability and accuracy.
How is Technographic Data Collected?
Technographic data is collected in two main ways:
- Web scraping
- Manual verification
The collected method used will mostly depend on if the technographic data source is accessed online (e.g. website source code) or offline (e.g. phone call). The collection method can also impact the data quality, as can the source being used.
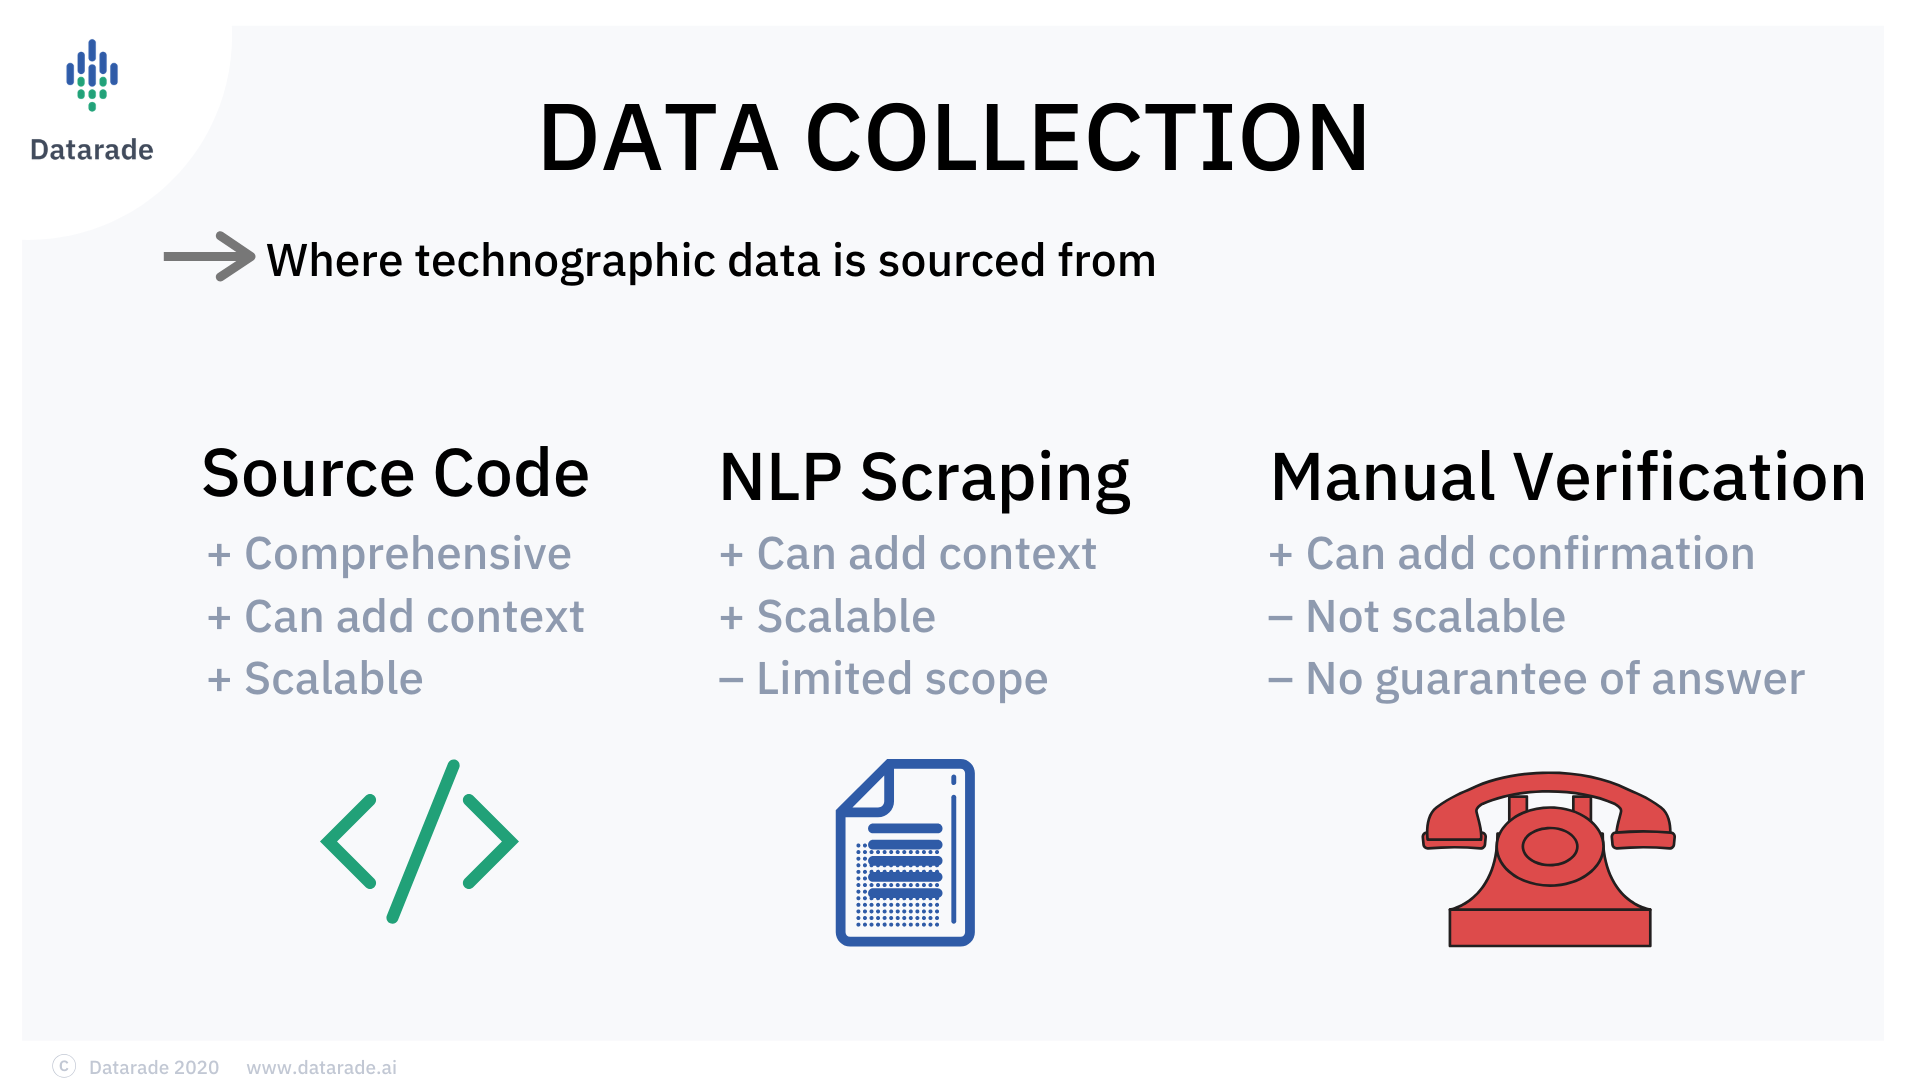
Each collection method has its pros and cons, but the overarching issue faced by companies is that technographic information is often not readily available, making it difficult to collect in the first place. Thus, collecting the data can be very time-consuming and resource-demanding for a company. For this reason, company managers are turning instead to data providers for their technographic software
Besides the saved time and effort, there are further benefits to buying technographic data from a data provider.
Firstly, you can rely on a technographics company to have a high level of experience and knowledge of the market. This way, you know that you’ll be using high-quality data that’s been carefully collected from a wide range of sources.
The second extra benefit is that third-party vendors often provide access to analytical software that you can integrate directly with your current business technologies. This enables you to feed real-time data into your decision making processes and perhaps enrich other existing data sets you might have for optimum technographics analysis.
How Can I Assess the Quality of Technographic Data?
When it comes to purchasing technographics, the quality aspects you need to ensure are accuracy, recency, and scale. Accurate data means that the listed technologies and uses are correct. Recency helps with context. Information on when the technology was acquired ensures that you know the company’s most up-to-date technological stack. Scale is important to make sure that the list of available companies offered by the data provider is suitable for your target market and to keep your leads pipeline full.
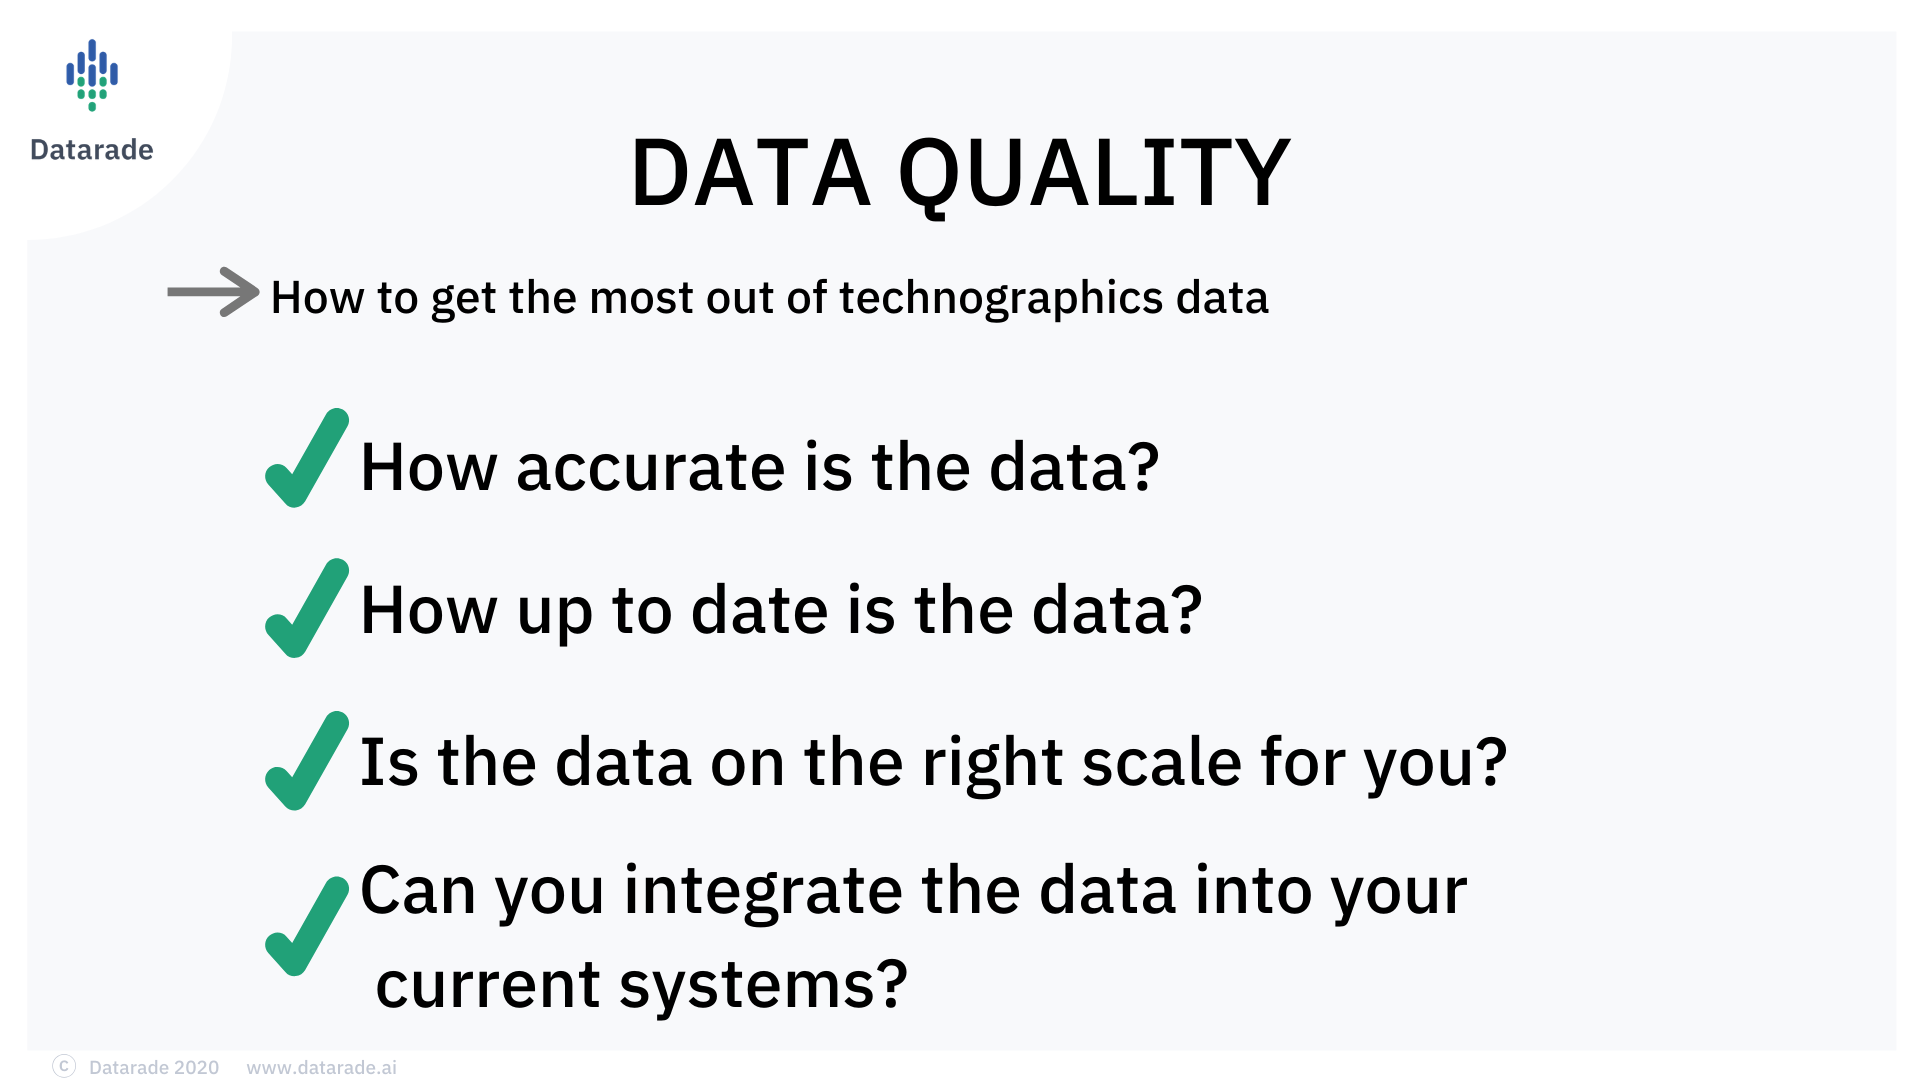
(Click image to enlarge)
Assessing the quality of technographic data can be tricky, but it’s a data provider’s job to assure you of the quality of their information.
To help you through the process of finding the right technographics provider for you, here are some questions you should ask data vendors you’re interested in:
- What are your technical data collection methods?
- What are your sources of raw data?
- How frequently do you update your data sets?
- Can you verify whether the company still uses the software?
- Can your dataset integrate seamlessly with my existing business technologies?
- Can I have a technographic data sample set to test the data?
When you’re confident that you can recognize high quality technographic data and that your provider offers exactly this, it’s time to make sure you know what you’ll be using it for and how this will benefit your business.
Frequently Asked Questions
What Types of Attributes are Included in Technographic Data?
Common attributes in technographic data include software applications, IT infrastructure, cloud adoption, and digital tools used by a company. Other useful data points may cover firmographics, purchasing behavior, and indicators of digital transformation, providing a well-rounded view of an organization’s technological profile. When choosing data, focusing on specific attributes that align with your marketing goals can enhance relevance.
How Accurate is Technographic Data?
Accuracy levels in technographic datasets often reach 95% or higher, maintained through regular verification and updates. Providers frequently combine automated checks with manual reviews to refine data quality. If your business relies on precise targeting, it’s beneficial to confirm the provider’s data verification methods.
How Often is Technographic Data Updated?
Update frequencies vary, with many providers offering monthly updates, while others offer weekly or daily refreshes for fast-paced industries. For companies that closely monitor technology adoption trends, choosing a provider with regular updates can help keep insights actionable.
What Are Common Delivery Methods for Technographic Data?
Technographic data is typically available in formats like CSV, JSON, or XLS and can be delivered through APIs, SFTP, or cloud solutions like Amazon S3. Some providers offer on-demand access through APIs, simplifying integration with CRM. Selecting a delivery method that aligns with your workflow can streamline access to this data.
Is Technographic Data Compliant with Privacy Regulations?
Our technographic data providers comply with regulations like GDPR and CCPA, particularly when handling personally identifiable information (PII). Nevertheless, ensure the provider you choose follows these guidelines and supports ethical, compliant data usage. We recommend verifying their privacy practices if data security is a priority for your campaigns.
Can Technographic Data Be Combined with Other Data Types?
Yes, technographic data is often combined with firmographic or B2B intent data to create more complete profiles of target businesses. This enriched data can support account-based marketing (ABM), competitive analysis, and trend forecasting, helping you develop focused marketing strategies. Our suggestion is to consider providers that offer integration across multiple data types.
