What is Stock Market Data? Examples, Datasets and Providers 2025


- Overview
- Datasets
- Providers
- Use Cases
- Attributes
- Guide
- FAQ
- Overview
- Datasets
- Providers
- Use Cases
- Attributes
- Guide
- FAQ
What is Stock Market Data?
Stock market data is information and statistics related to the trading of stocks and other financial instruments. It includes real-time and historical data on stock prices, trading volumes, market indices, company financials, and other relevant metrics. This data is crucial for investors, traders, and analysts to track market trends and assess the performance of individual stocks or the overall market.
Best Stock Market Databases & Datasets
Here is our curated selection of top Stock Market Data sources. We focus on key factors such as data reliability, accuracy, and flexibility to meet diverse use-case requirements. These datasets are provided by trusted providers known for delivering high-quality, up-to-date information.
Global Stock Market Data | Equity Market Data | 80K stocks | 150 pricing sources | Intraday Data
Stock Market Data Africa ( End of Day Pricing dataset )
Grepsr | Stock Market Datasets | Global Coverage with Custom and On-demand Datasets
TagX - Stock market data | End of Day Pricing Data | Shares, Equities & bonds | Global Coverage | 10 years historical data
Africa & Middle East | Insider Trading Data | 25+ Years Historic Data | Stock Market Data | Public Equity Market Data for Investment Management
PredSearch | Alternative Data, Hedge Funds Data, Stock Market Data, Investors Data | Consumer Stocks Signal | Global coverage | 100+ Tickers
US Common Stock Market Data with more than 4000 Securities - i1 US
Finage Real-Time & Historical Widgets Tick-By-Data - Stock Market Data for USA & UK
Historical Stock Market Price Data
Financial Derivatives EoD Pricing | Index Futures and Options | Volatility, Stock Market Index | VIX, S&P500, DJIA, NASDAQ, DAX, CAC | USD, etc.
Can't find the data you're looking for?
Let data providers come to you by posting your request
Post your request
Top Stock Market Data Providers & Companies
-

FIDA
FIDA is a technology driven Italian company with offices in Torino, Milano and Paris, that develops applications for wealth managers, private bankers, asset managers and Fintech companies. The company provides extensive Fund and ETF data as well as ESG portfolio analysis and global market data.FlexibleAccess the data that you needReactivityAdress data questions promptlyFair priceNo unexpected data bills -

Consumer Edge
CoverageUSAUK+248Consumer Edge is a leader in alternative consumer data for public and private investors and corporate clients. Transaction data, scanner data, web data, and email receipt data spans dozens of industries, hundreds of companies, and global geographies to empower strategic decision-making.100M+Credit & Debit Cards30K+Public & Private Brands700+Parent Companies -
 Promoted
Exchange Data International
CoverageUSAUK+248With EDI you get high quality, affordable financial data customized to precisely fit your operational requirements.ISO9001CertifiedISO27001Certified1.5 mSecurities -

TagX
CoverageUSAUK+248VWe requested data in the form of various forms and documents associated with Tax and Bookkeeping that we plan to use to developing a digital document processing solution based on artificial intelligence.
-
Techsalerator
CoverageUSAUK+248VBest service, must use!! Helped me generate a lot! Thank you so much for your outstanding work!! Will definitely recommend to my fellow workers and friends!!
Popular Use Cases for Stock Market Data
Financial and stock market data has its uses in a number of professions: traders, investors, stock market brokers, or analysts. But how exactly are these people using this data? Here are just some of the use case of financial and stock market data:
Predictive Analysis
Predictive analysis means predicting how an asset’s value could change in the future. The value of an asset is based upon a lot of factors, and it can fluctuate on a minute by minute basis.
Having an idea whether the value of a stock market asset will rise or fall can tell when you’re set to make a profit or a loss.
In addition, financial and stock market data also tells you about the number of trades that you will need to make in order to meet your profit margin (or maximize it).
Charts
Financial and stock market data is also used to make charts, which are the backbone of stock market trading around the world. Charts help investors and traders have a clear, physical means of conceptualizing the global stock market in all its complexity.
Most financial and stock market decisions are based on historical trends.
These trends can be seen most clearly when they’re depicted on a chart, which shows you exactly how an asset has increased or decreased in value, with different shapes and graphs favoured by certain analysts.
Enter and Exit Decisions
Stock market traders and investors are constantly looking for assets to trade or invest in. Financial and stock market data can predict the bid prices of an asset, showing you the asset’s value and its how it’s expected to perform in future. Based on this bid price, you can decide to enter or exit trading.
Timing also comes into play - financial and stock market data can tell you not just whether to enter or exit a trade, but when, in order for you to make the most profit from your trading decisions.
Main Attributes of Stock Market Data
Below, we outline the most popular attributes associated with this type of data—features that data buyers are actively seeking to meet their needs.
| Attribute | Type | Description | Action |
|---|---|---|---|
| String | The ticker symbol of a stock. | View 18 datasets | |
| String | The name of a company or business, might be the legal or brand name. | View 14 datasets | |
| String | The name of a country. | View 11 datasets | |
| Integer | An unique identifier (ID) of a company. | View 9 datasets | |
| String | A hashed email address with algorithms like SHA, MD5, etc. | View 9 datasets | |
| String | Mobile Ad ID is a sequence of random symbols, given by the mobile device’s operating system. It’s shared with the servers of the apps that the user is using to track his customer journey and “remember” his or her choices. | View 9 datasets |
Stock market data types
Financial and stock market data is data which tells you about the assets (stocks, shares and derivatives) of various markets and companies across the world. As a data category, stock exchange data is commonly separated into pre-trade and post-trade data.
Pre-trade Data
Pre-trade data will tell you about the bid/ask price of a particular asset. Pre-trade stock data is helpful when it comes to stock market analysis, meaning you can enter the bidding process with a clear understanding of the asset’s value based on historical trends.
Post-trade Data
Post-trade data will tell you about the transaction which took place when an asset was sold, including its last trade price. Stock transaction data can also include other details about the trades that are made in any particular segment of the stock market.
Once you have a stock market data subscription, you and conduct pre- and post-trade analytics relevant to the industry you’re interested in. From here, you can make data-driven stock market trading decisions based on stock market intelligence.
Common Attributes
The most common attributes of financial and stock market data are to do with bidding, trading and financial ratios. Let’s look at each of these in more detail:
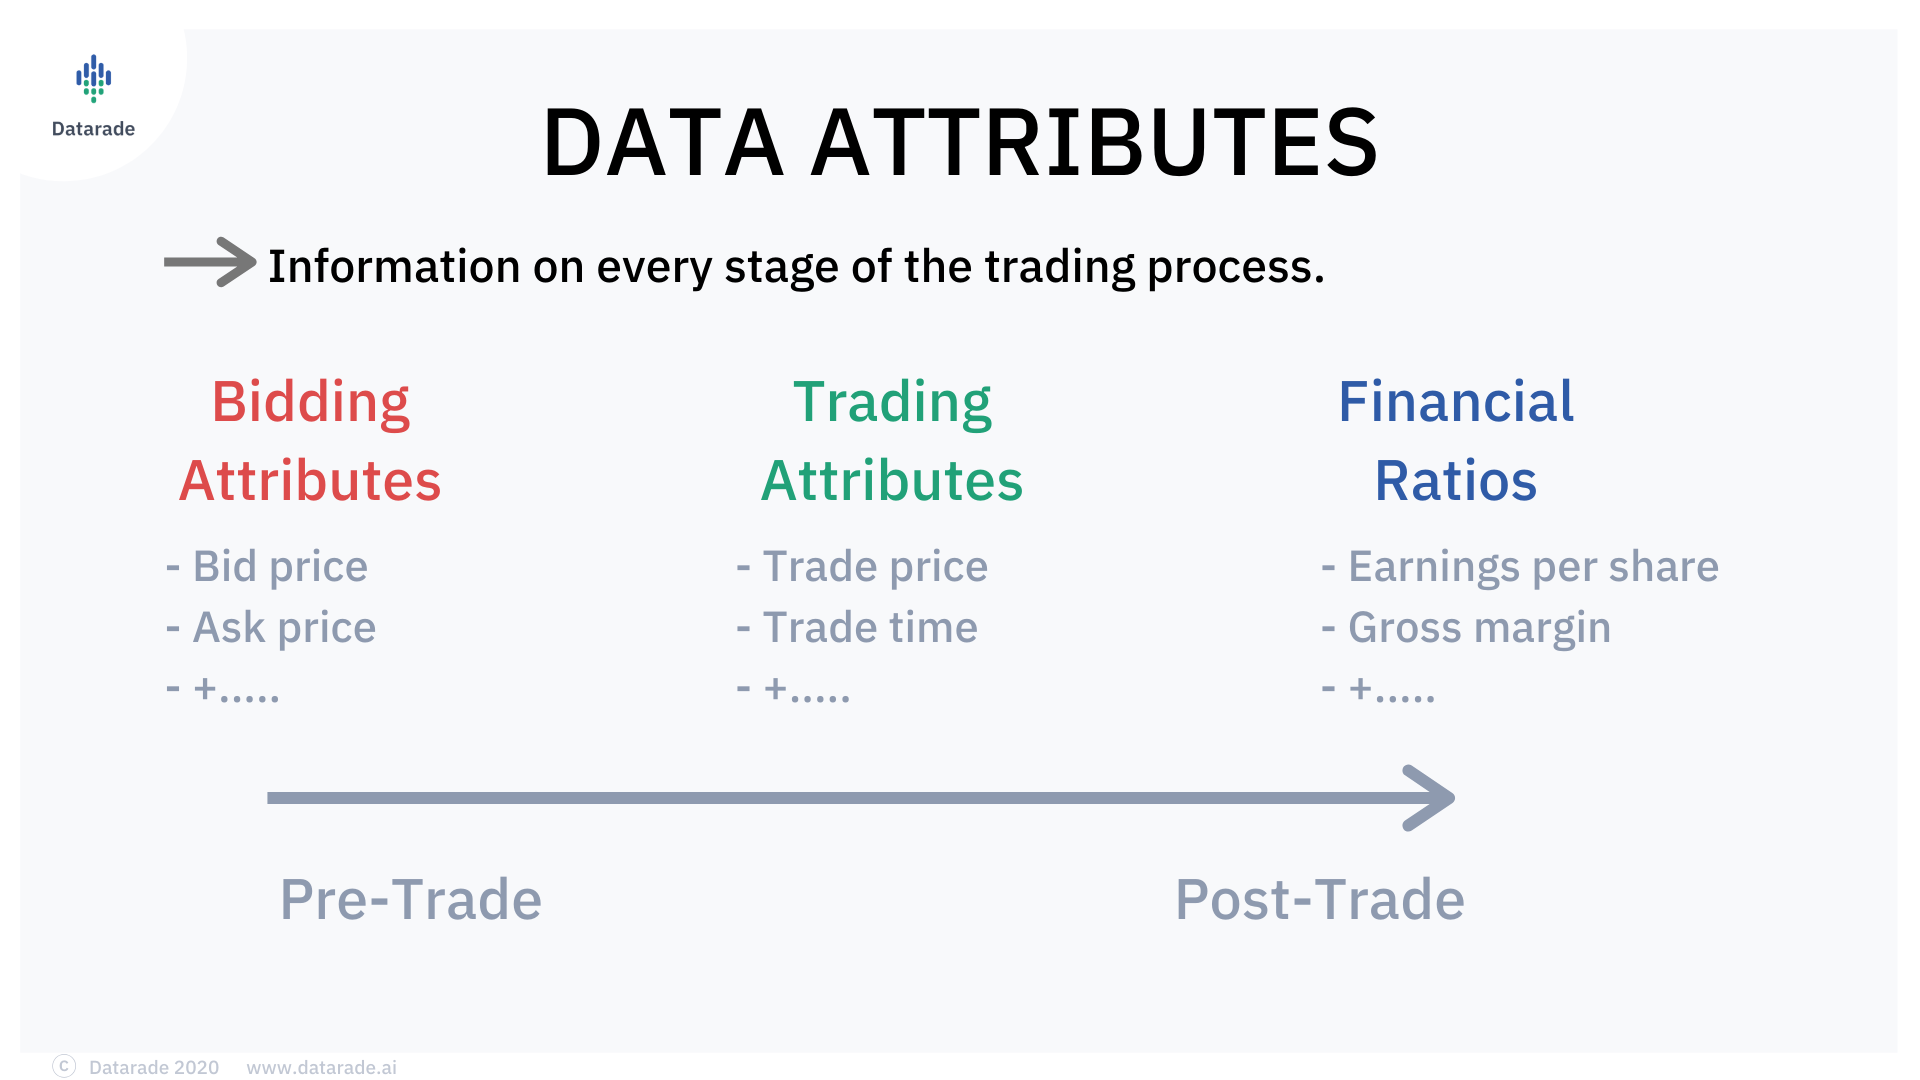
Bidding Attributes
The bidding attributes of a stocks dataset include the most recent bids, as well as the average bids for a particular time period. These will vary between market data providers.
In general, bidding attributes consist of:
Bid Price – The maximum price at which the investor or trader is willing to buy a particular stock, share or derivative.
Ask Price – The minimum price at which the seller agrees to sell any particular asset.
Trading Attributes
Trading attributes are stock market data attributes which tell you about what happened during a given trading window on the stock exchange. Generally, trading attributes include:
Price of Trade – This is calculated by dividing the sum of all the trades that are made during a particular trading window with the number of trades. It’s considered the average price of the trade.
Time of Trade – The times at which a particular trade occurs can be very valuable to an intraday trader. These details tell you how the price of an asset fluctuates throughout the day.
Ticker Symbols
Stock exchanges use abbreviated names of the stocks and shares up for trading instead of their full names. This shortened version is called the ‘ticker symbol’. Financial market data and stock market data vendors can list the ticker symbols for various assets of interest. These ticker symbols then correspond to the company listed on the stock exchange. A stocks database can then provide further stock market analytics, such as:
Total Revenue – This tells you about how much the company earned in a particular period of time.
Total Liabilities – These will tell you about how much the company owes to public investors or to other firms at any given time.
Financial Ratios
Financial ratios are useful for analyzing averages and identifying trends across a broad trading data set. Identifying these trends by looking solely at single trades can be hard if a large number of trades are made in a short time period. This is where financial ratios from a stock data database become the trader’s secret weapon.
Financial ratio attributes in a stock dataset can include:
Earnings per Share – Earnings per share can be calculated by dividing the total profits for shares divided by the number of shares traded for that asset.
Gross Margin – The gross margin of a company is calculated by taking the total revenue of the company and subtracting from it the costs incurred to provide their goods and services. It can be seen as an indicator of the profit made by the company, and its value is generally presented as a percentage.
Free Cash Flow
Free cash flow is the total cash that a company has produced by selling its goods and services, minus the cost incurred for expenditures on the operations and production of assets.
So, the attributes of any financial market data set will probably fall into either the bidding, trading or financial ratios category. If you’re looking to buy stock market data with particular attributes, it’s always good to compare a few providers first to find the best database for your unique requirements, and once you’ve found one that looks good, to double check with them whether they have the information you need to enhance your analytics and decisions.
Now’s a good time, then, to learn about financial and stock market data sources. These are what vendors use to collect and compile their stock market raw data feeds.
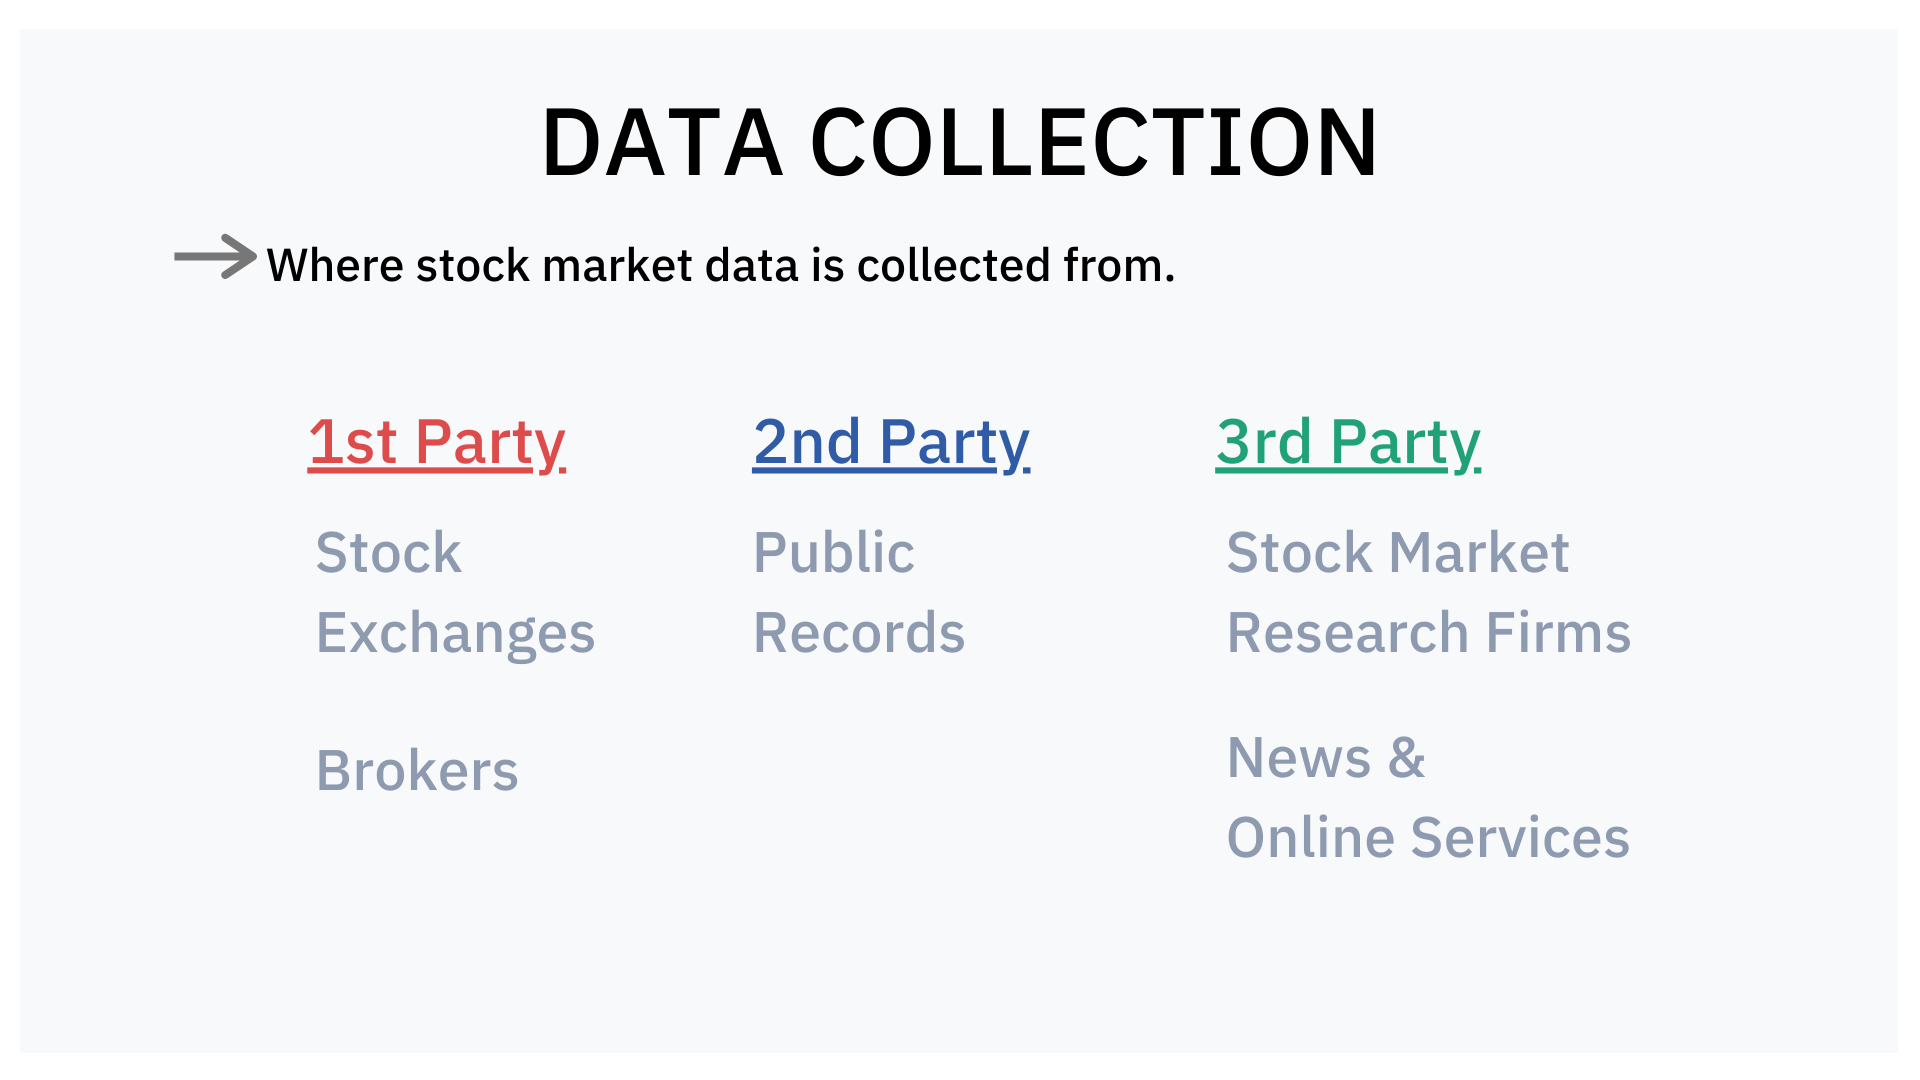
Stock market data collection
To create a financial and stock market data feed, information is gathered from various sources. These sources include stock market research firms, news aggregators, stock exchanges themselves, public records, brokers and specialized online services. With the digitalization of market exchanges around the world, most of this information is now collected through the sources available online and stored as raw stock market data.
Here’s an explanation of each source and methodology used for financial and stock market data collection:
Stock Market Research Firms
There are various companies and software creators that work solely to analyze and provide stock market data services in the form of graphs, charts, figures and statistics. A financial and stock market data vendor often uses these research firms as a source of stock market data.
The information that a stock data provider can collect from stock market research firms is highly accurate, making the data compiled from stock market research firms incredibly useful for stock market analytics.
Generally, the data providers partner with the market research firm to create their database. Otherwise, many stock market research firms also make this data available to a user through subscriptions of their software packages and other methods. A data provider can access the information through these channels as well. A stock market research firm can itself be a data provider too.
News Aggregators
When news aggregator engines are employed for financial and stock market data collection, they constantly trawl the internet for any news that relates to the trading of a particular asset or a range of assets. This information is then verified and compiled in stock market datasets.
Much of the information which comprises a financial and stock market dataset can be obtained from news outlets which discuss the conditions of the stock market, and the main movers and shakers in that market, including the relevant bidding information. It’s up to the stock market database provider to distinguish between the content on news platforms. Some financial markets data is objective, factual information, whereas other news reports are purely speculation and prediction from experts and pundits, so aren’t completely reliable market data sources.
Stock Exchanges
Stock exchanges themselves publish the details about the assets that are being traded on their platform constantly. There, you’ll find detailed analytics about a given trading period, including the latest price of an asset, the closing price, the number of trades, etc. A stock exchange dataset vendor compiles and categorizes all of this information, and sifts it to suit the user’s needs.
Public Records
Exchanges often file public documents that provide a crucial insight into trading activity. The best financial market data providers will consult these documents when compiling their dataset: they often contain information which has been provided due to regulatory measures.
For example, SEC filings need an exchange to disclose financial information about the trades that were made for a number of assets. Such information makes for an accurate and detailed source of financial markets data.
Some public records are freely available on the internet to download, however many require to visit the office physically to collect the records. A financial and stock market data provider removes this obstacle: their stock trade data fully automated and accessible whenever you need it.
Expert Opinions
Stock market experts can provide as valuable information as the stock market facts can. The opinion collected from stock market experts can be speculative in nature, and can discuss potential future trends.
This information is not as accurate as other sources due to its speculative nature. However, due to their vast experience in the fields, the information collected from the experts can help in making better trade decisions.
Brokers
Most traders don’t trade on an exchange personally. Instead, they employ brokers who do the trading for them. There are many popular brokers that have a vast number of clients which include large scale firms.
A data provider can get valuable information by collecting it through these brokers. However, the quality of information provided by brokers can vary hugely. Some provide impartial, data-supported insights; others are simply speculative sources.
Like with news aggregators, it’s up to the data provider to verify that the sources and methods of their data is reliable - in the sense that their stock trading data is pulled from from raw stock market data, not the predictions of one individual.
Dedicated Online Services
There are several online services such as Google finance which specifically provide information related to financial and stock market data. The data provider can directly use these services to fill in the gaps in their database, so that the financial and stock market data you’ll receive is as detailed and scalable as possible.
The information that is collected from these sources is format specific to the sources themselves. Due to this, the data vendors first format this information internally.
The information is compiled in a consistent format that makes it easier to analyze and understand. Any errors encountered are corrected during this phase.
Looking at these sources of financial and stock market data, we’ve come across several factors which can influence the quality of the data collected by the provider. With this in mind, let’s look at how you can be sure that your data provider is going to the adequate lengths to ensure that their data is high quality.
Quality Assessment
The key to ensuring that the financial and stock market data you receive from a data vendor is high quality is to verify their sources and collection method. This verification process means you’ll have to consider authenticity, reliability, impartiality, recency, precision, and relevance. All of these factors come into play and dictate whether a vendor’s financial and stock market data is high quality or not. The better the quality the market data is, the more it will be of value to you, however you plan to utilize it:

Authenticity
First things first, it’s essential to verify that the financial and stock market data that you are thinking of acquiring is actually authentic. This means that the data is based on facts and figures, and not on opinions from lesser known market experts.
Any data that comes from such inauthentic sources should be avoided, and a good data provider will be able to authenticate any data which comes from an individual stock market commentator with solid numbers.
Reliability
For you to be able to use your financial and stock market data to make better investment decisions, you need to be sure that you can rely on what it’s telling you.
The more reliable the data provider, the more reliable the data, so it’s alway sensible to read testimonials and reviews left by customers who have bought financial and stock market data from the vendor in question. If previous customers do not report good results from the dataset, or that the provider was problematic, then you should re-consider before engaging further with that stock market data provider.
Impartiality
In the financial and stock market field, the losses incurred by one trader may add to the profits of another. Therefore, you need to make sure that the data you’re acquiring is totally impartial and will not lead you to make decisions geared towards the benefit of the data provider. A good way of ensuring impartiality is to see whether your provider undergoes independent audits and has certificates to prove this.
Furthermore, you should also make sure that the stock market database is an evaluation of facts and figures - raw stock market data. Comparing datasets from a range of vendors and sources can be a good method of spotting where there are gaps, and why. High-quality, impartial financial and stock market data will give you a clear, objective understanding of the financial landscape, rather than the picture the data provider may want you to see.
Recency
The stock market is volatile: trading decisions are made seconds after events and news flashes occur. Therefore, it is important to have the most recent information at hand - live stock market data. When selecting your financial and stock market data vendor, it’s vital that they can ensure you’ll receive the latest information about real-time trades and values. A real-time stock market data feed ensures this.
A delay in information could mean that by the time you analyze the data and make a decision, the rest of the traders have already acted upon it, and the opportunity to invest or sell has gone. This can lead to losses and unutilized profits for traders and investors. If a vendor can offer you an automated, real-time stream of financial and stock market data, you can be sure you’re working with the most up-to-date information.
Relevance
As we’ve seen, there are various types of assets which are traded on the market - stocks, shares and derivatives. And offering these assets are dozens of industries, made up of hundreds of companies. With so much financial and stock market data out there, it’s important to check that your data provider can give you the information about the field you’re interested in. With relevancy, quality becomes entirely dependent on your needs as a trader or investor.
Just because a vendor’s data is considered high quality in terms of its precision, impartiality and so on, if it doesn’t have good focus in the information you personally need, then the stock data vendor might not be the right data partner for you.
Industries using Stock Data
We’ve mainly been talking about how financial and stock market data is used by traders and investors. However, there are numerous professions that make the use of this data type to improve their analysis and decision-making. Let’s have a look at some use cases and stock market data usage examples:

Traders and Investors
Financial and stock market data is of immense importance to traders.
While in the stock market there can be no guarantee of trade success, financial and stock market data can help you make calculated, low-risk decisions.
Intraday traders make use of stock trading data at minute intervals to assess which quick decisions need to be taken. They can also analyze how the price of a commodity tends to vary throughout the day.
More generally, traders can make use of long term financial and stock market data to analyze the trends that are emerging in the market. Historical market data providers also refer to older data to verify historic trends which can help them make more informed decisions in the present.
Investors
For stock market investors, it’s their own money at stake. Investors are generally looking for placing their money in a particular asset and holding it for the long run. So it’s in their best interest to minimize the risk of losing out by making data-informed decisions. Being able to predict whether an asset or instrument’s price will rise or fall is at the core of all strategies formulated by the investor.
Investors who begin trading in penny stocks can soon generate large profits by becoming aware of the pre-and post-trade trends which determine whether a stock is a wise investment or not. If you’re an investor, don’t treat trading stocks like a gamble which won’t always pay off – utilize data to base decisions on concrete evidence, and save time by acquiring a dataset which eliminate the need for you to carry out the research yourself.
Brokers
The breadth and depth of financial and stock market data can be dizzying. To demystify this data type, stock brokers are often hired by traders and investors to select which data is relevant to the investor and their preferred industry.
The broker is responsible for identifying potentially profitable markets and advising their client accordingly. Because brokers are mostly paid on commission, it’s important that their stock price predictions are as reliable as possible. The greater the client’s profit, the more the broker earns in commission. So for brokers, high-quality financial and stock market data data-driven is of twofold significance. Firstly, to make commission for their services. Secondly, to establish themselves as trustworthy sources of advice for potential clients.
Market Research Agencies
Very often, traders and investors who are trading without brokers don’t enter the financial and stock market data themselves. Instead, they work with market research agencies, who use financial and stock market data to carry out their market data analytics. At times, this data is used by agencies which do not assist the clients one on one. Instead, the information is provided through reports and data that can be accessed through subscriptions or through their software and services.
In-house Analysts
Analysts forecast how the stock market might change in future and pass this information on to investors and traders, who hire them to do the necessary research for them.
The data used to predict stock prices should not be just consider historical trends, but factor in future events which could alter the state of the value of markets and industries globally. When analysts enrich their charts and patterns with this in mind, their predictions become more accurate. Their predictions influence people from all fields, from the Wall Street broker, to the everyday consumer concerned with saving money on commodities like petrol and groceries.
Analysts become successful as the frequency that their predictions come true increases - and for this to happen, they must be able to access the right financial and stock market data.
Pricing
Wondering how to access stock market data? There is no fixed price or payment model for financial and stock market data. The price depends on the data provider in question and the products they offer, as well as your needs as a data buyer.
Generally, there are three common pricing models that are available when it comes to financial and stock market data. These include:
Subscription Model
You can get financial and stock market data from various vendors with a regular subscription model. With this structure, you have to pay a fee to the data provider for their data at regular intervals.
The benefit of the subscription model is that to retain their customers, data providers update the data regularly. Therefore, you don’t have to worry about getting outdated data.
The disadvantage of the subscription model is that you have to pay the data provider for continued use of their data. Therefore, you don’t technically own the data, and so must pay so that you’re allowed to use it.
One-time License Fee:
With a one time license fee, you only have to pay for the financial and stock market data once. After that, the data is free for you to use. However, the one time payment is substantially larger than the monthly subscription fee.
The advantage of the one time license fee is that it leads to savings for you for long term usage.
Such a pricing model is more suitable for use cases where you are aiming to analyse historical data in order to create predictions about the future.
Customized Solutions:
Many data vendors also offer tailored solutions to their clients that can match their needs exactly. These solutions can include a mix of the subscription model and a one time fee. For example, the provider could give you large batches of data with longer times between updates than you’d usually get from a subscription model.
All the pricing models are popular amongst data buyers - which one you opt for depends entirely on your needs. However, it’s worth keeping in mind that, where the financial and stock market is concerned, decisions are often made on the latest figures, so keeping your data updated as often as possible is crucial.
Most stock market data providers will let you sample stock market data before you buy a dataset. A data sample means you can choose the best database for stock data, in confidence.
Frequently Asked Questions
How is the Quality of Stock Market Data Maintained?
The quality of Stock Market Data is ensured through rigorous validation processes, such as cross-referencing with reliable sources, monitoring accuracy rates, and filtering out inconsistencies. High-quality datasets often report match rates, regular updates, and adherence to industry standards.
How Frequently is Stock Market Data Updated?
The update frequency for Stock Market Data varies by provider and dataset. Some datasets are refreshed daily or weekly, while others update less frequently. When evaluating options, ensure you select a dataset with a frequency that suits your specific use case.
Is Stock Market Data Secure?
The security of Stock Market Data is prioritized through compliance with industry standards, including encryption, anonymization, and secure delivery methods like SFTP and APIs. At Datarade, we enforce strict policies, requiring all our providers to adhere to regulations such as GDPR, CCPA, and other relevant data protection standards.
How is Stock Market Data Delivered?
Stock Market Data can be delivered in formats such as CSV, JSON, XML, or via APIs, enabling seamless integration into your systems. Delivery frequencies range from real-time updates to scheduled intervals (daily, weekly, monthly, or on-demand). Choose datasets that align with your preferred delivery method and system compatibility for Stock Market Data.
How Much Does Stock Market Data Cost?
The cost of Stock Market Data depends on factors like the datasets size, scope, update frequency, and customization level. Pricing models may include one-off purchases, monthly or yearly subscriptions, or usage-based fees. Many providers offer free samples, allowing you to evaluate the suitability of Stock Market Data for your needs.
What Are Similar Data Types to Stock Market Data?
Stock Market Data is similar to other data types, such as Cryptocurrency Data, Alternative Data, ESG Data, Credit Rating Data, and Commodity Data. These related categories are often used together for applications like Algorithmic Trading and Trading.
